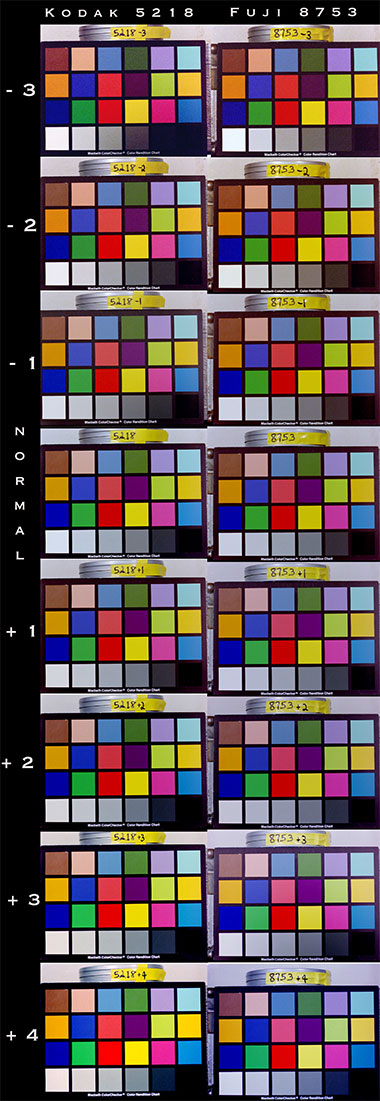
5218 - 8573 comparison
The Macbeth Charts were shot with the same camera and lighting with a Zeiss SuperSpeed Mk2 35mm lens . The only variables are the ones marked. The stock and processing was normal and both rolls were sent to the lab together. I probably underestimated both stocks latitude and should have gone to four stops under and five over during the test shoot.
The negatives were scanned by Leonard Coster of Sydney's SpeedWedge with their own proprietary 4K scanner. Both rolls of film were preceded with a grey chart exposed normally and the scanner was color balanced and exposed to this grey card. Scanner exposure did not change as camera exposures changed.*
These frames were graded in Combustion from the full dynamic range 10 bit Log scans and converted to 8 bit Linear. Colour corrections were done by Cineon code values rather than visually- so I wasn't relying on a monitor an LUT being correct.
Only Primary Colour Correction was used so that the grey scale has been balanced at Grey Card level. White and Black points have been level corrected as has gamma for the 18% grey card level.
Finally a composite image as an 8 bit JPEG was created for direct comparison.
The point of putting this test on the web is for you to make your own judgements. Both stocks behave extremely well and at nominal exposure are hard to differentiate and I continue to shoot both stocks.
Ben Allan ACS & Tom Gleeson
click on the image for a full size frame
* An interesting variation would have been to reset exposure on the scanner to compensate for camera stop changes and see how this would affect the results. Time and money :-(
I would also imagine the “personality” of the scanner would have some bearing on our results.
NB I am not a scientist or a technician just an average camera jockey. Therefore best practice during testing was attempted at all times but feel free to do your own tests and see what you get.
Copyright © CML. All rights reserved.
- aces.png
- aces.png
- aces.png
- aces.png
- 24-7.jpg
- 24-7.jpg
- arri.png
- arri.png
- BandH.jpg
- camalot.png
- camalot.png
- dedo.png
- dsc.png
- dsc.png
- kino.png
- Hawk.png
- JustCinemaGear.jpg
- Leitz_logo.png
- Leitz_logo.png
- Lowing.gif
- Module8Logo.png
- GodoxLogo.png
- Nanlux.png
- NPV_new_logo-(3)-(002).png
- NMBLogoForCML.png
- lindseyo.jpg
- Aputure.png
- TC Logo Centered K_2.png
- VMI.png
- zeiss-logo.png
- zeiss-logo.png
- aces.png
- aces.png
- aces.png
- aces.png
- 24-7.jpg
- 24-7.jpg
- arri.png
- arri.png
- BandH.jpg
- camalot.png
- camalot.png
- dedo.png
- dsc.png
- dsc.png
- FUJINON.jpg
- JustCinemaGear.jpg
- Leitz_logo.png
- Leitz_logo.png
- GodoxLogo.png
- Nanlux.png
- NPV_new_logo-(3)-(002).png
- NMBLogoForCML.png
- FilmLightLogo.png
- theKeep.png
- NewLifeCineLogo.png
- PostWorks.png
- Aputure.png
- TCS.png
- TC Logo Centered K_2.png
- zeiss-logo.png
- zeiss-logo.png
- aces.png
- aces.png
- aces.png
- aces.png
- 24-7.jpg
- 24-7.jpg
- arri.png
- arri.png
- BandH.jpg
- camalot.png
- camalot.png
- dedo.png
- dsc.png
- dsc.png
- kino.png
- Hawk.png
- JustCinemaGear.jpg
- Leitz_logo.png
- Leitz_logo.png
- Lowing.gif
- Module8Logo.png
- GodoxLogo.png
- Nanlux.png
- NPV_new_logo-(3)-(002).png
- NMBLogoForCML.png
- lindseyo.jpg
- Aputure.png
- TC Logo Centered K_2.png
- VMI.png
- zeiss-logo.png
- zeiss-logo.png
- aces.png
- aces.png
- aces.png
- aces.png
- 24-7.jpg
- 24-7.jpg
- arri.png
- arri.png
- BandH.jpg
- camalot.png
- camalot.png
- dedo.png
- dsc.png
- dsc.png
- FUJINON.jpg
- JustCinemaGear.jpg
- Leitz_logo.png
- Leitz_logo.png
- GodoxLogo.png
- Nanlux.png
- NPV_new_logo-(3)-(002).png
- NMBLogoForCML.png
- FilmLightLogo.png
- theKeep.png
- NewLifeCineLogo.png
- PostWorks.png
- Aputure.png
- TCS.png
- TC Logo Centered K_2.png
- zeiss-logo.png
- zeiss-logo.png


